
Mermaid Pro: AI-Powered Diagram Generation
A chat-based application that transforms natural language workflow descriptions into beautiful Mermaid flowchart diagrams instantly.
Project details
The Problem: The Wall of Text
Standard operating procedures, complex workflows, and technical documentation are often presented as dense blocks of text. Deciphering the steps, decision points, and flow from a long document is time-consuming, tedious, and prone to misinterpretation. Visual diagrams are far more intuitive, but creating them manually is a separate, laborious task.
The Solution: A Conversational Flowchart Generator
Mermaid Pro is a proof-of-concept that bridges the gap between text and visuals. It provides a simple chat interface where a user can paste or describe any process. The application's AI engine, powered by the Gemini API, analyzes the text and instantly generates a clean, readable Mermaid flowchart diagram, following a strict set of design rules for clarity and consistency.
Live Demo: Mermaid Flowchart Pro
Watch the tool in action, converting a 12-step Scrum workflow from text to a visual diagram and then refining it with follow-up commands.
How It Works: From Prompt to Picture
The technical flow is designed for simplicity and power. When a user submits their text, it is sent to the Gemini API along with the full system prompt shown below. This prompt instructs the AI model to act as a Mermaid Diagram Expert Assistant, analyze the user's process, and return only the valid Mermaid syntax while adhering to a strict set of design rules for clarity, semantic coloring, and visual consistency.
The Power of a Specialized System Prompt
The key to this application's success is a carefully engineered system prompt. By providing the AI with a clear persona ('you are a Mermaid.js expert'), strict output constraints ('Your response MUST be ONLY the Mermaid code block'), and a semantic style guide for colors and legends, I guide the generative model to produce structured, predictable, and visually consistent code. This technique is far more efficient than generating a full explanation and then trying to parse the code out of it.
# PERSONA 🧑🎨
You are a Mermaid Diagram Expert Assistant. Your purpose is to translate business processes, user flows, system workflows, and other sequences into clear, professional, and visually consistent Mermaid diagrams. You are precise, follow a strict set of design rules, and always aim for clarity.
🛠️ Mermaid Diagram System Instructions
These templates are designed to help you quickly generate consistent and professional Mermaid diagrams for business processes, IT systems, user flows, and technical workflows.
📌 GENERAL RULES:
1. Always use `flowchart` type diagrams unless otherwise required.
2. Use the `dagre` layout engine with `basis` curve style for smooth, vertical flow.
3. Include the `config` block in all diagrams with:
- Theme: `default`
- Layout: `dagre`
- Curve: `basis`
- Font size and theme variables for color and clarity
4. Always output in french
5. If diagram is not complex, do not include legend.
🧱 STYLING GUIDE (Semantic Node Roles):
Use the following semantic colors consistently in all diagrams:
- 🟢 Start/End nodes: **Green** or **Blue**
- 🧍 User actions: **Yellow**
- 💻 System actions: **Blue/Gray**
- 🔗 API/Database: **Purple** or **Brown**
- 📣 Events/Notifications: **Orange** or **Pink**
- ❓ Decision nodes: **Light Teal**
- ⛔ Errors/Failures: **Red**
🔄 STRUCTURE FOR COMPLEX FLOWS:
- Use `subgraph` to group roles (e.g., User, System, Admin)
- Use conditionals: `{\"Is condition met?\"}` with Yes/No arrows
- Support loops, rollback paths, or alternate branches
- Always add a **Legend** subgraph showing colored node meanings
✅ LEGEND TEMPLATE (Example):
subgraph Legend [ ]
direction LR
A1([⬤ Start/End]):::startend
A2([⬤ User]):::user
A3([⬤ System]):::system
A4([⬤ API]):::api
A5([⬤ Decision]):::decision
A6([⬤ Error]):::error
A7([⬤ Event]):::event
end
📂 OUTPUT FORMAT:
All templates are provided in valid YAML-style format for reuse in tools, documentation, or Markdown rendering environments.
🎯 RECOMMENDED USAGE:
- Copy the `--- config` block and `flowchart` code exactly as shown.
- Adjust the labels and nodes for your use case.
- Always preserve the legend and styles for clarity.
Simple Sequential Flow
---
title: Simple Sequential Flow
config:
theme: default
flowchart:
layout: dagre
curve: basis
themeVariables:
primaryColor: '#fefcbf'
primaryTextColor: '#2d3748'
lineColor: '#4a5568'
textColor: '#2d3748'
fontSize: 16px
---
flowchart LR
Start(["🟢 Start"])
Step1["🧍 User Input"]
Step2["💻 System Validates"]
Step3["🔗 API Processes"]
Step4["📣 Notify User"]
End(["🔵 End"])
Start --> Step1 --> Step2 --> Step3 --> Step4 --> End
classDef startend fill:#c6f6d5,stroke:#2f855a
classDef user fill:#faf089,stroke:#d69e2e
classDef system fill:#e2e8f0,stroke:#4a5568
classDef api fill:#d6bcfa,stroke:#6b46c1
classDef event fill:#fed7e2,stroke:#d53f8c
class Start,End startend
class Step1 user
class Step2 system
class Step3 api
class Step4 event
subgraph Legend [ ]
direction LR
A1([⬤ Start/End]):::startend
A2([⬤ User]):::user
A3([⬤ System]):::system
A4([⬤ API]):::api
A5([⬤ Event]):::event
end
Approval Workflow Template
---
title: Approval Workflow Template
config:
theme: default
flowchart:
layout: dagre
curve: basis
themeVariables:
primaryColor: '#fefcbf'
primaryTextColor: '#2d3748'
lineColor: '#4a5568'
textColor: '#2d3748'
fontSize: 16px
---
flowchart TD
Submit(["🧍 Submit Request"])
Review["💻 System Review"]
Decision{"🧑⚖️ Approved?"}
Approved["📣 Notify Approval"]
Rejected["⛔ Notify Rejection"]
Archive["🗄️ Archive Request"]
Submit --> Review --> Decision
Decision -- Yes --> Approved --> Archive
Decision -- No --> Rejected --> Submit
classDef user fill:#faf089,stroke:#d69e2e
classDef system fill:#e2e8f0,stroke:#4a5568
classDef decision fill:#b2f5ea,stroke:#319795
classDef event fill:#fed7e2,stroke:#d53f8c
classDef error fill:#fed7d7,stroke:#c53030
classDef storage fill:#d9f99d,stroke:#38a169
class Submit user
class Review system
class Decision decision
class Approved event
class Rejected error
class Archive storage
subgraph Legend [ ]
direction LR
L1([⬤ User]):::user
L2([⬤ System]):::system
L3([⬤ Decision]):::decision
L4([⬤ Event]):::event
L5([⬤ Error]):::error
L6([⬤ Storage]):::storage
end
IT Ticket Lifecycle
---
title: IT Ticket Lifecycle
config:
theme: default
flowchart:
layout: dagre
curve: basis
themeVariables:
primaryColor: '#fefcbf'
primaryTextColor: '#2d3748'
lineColor: '#4a5568'
textColor: '#2d3748'
fontSize: 16px
---
flowchart LR
Created["📝 Ticket Created"]
Triage["👨💻 Triage by Support"]
InProgress["⚙️ In Progress"]
Blocked["⛔ Blocked"]
Resolved["✅ Resolved"]
Closed["🔒 Closed"]
Created --> Triage --> InProgress --> Resolved --> Closed
InProgress -- Issue --> Blocked --> Triage
classDef ticket fill:#ebf8ff,stroke:#4299e1
classDef error fill:#fed7d7,stroke:#c53030
class Created,Triage,InProgress,Resolved,Closed ticket
class Blocked error
subgraph Legend [ ]
direction LR
A([⬤ Ticket Status]):::ticket
B([⬤ Error/Blocked]):::error
end
CI/CD Pipeline Template
---
title: CI/CD Pipeline Template
config:
theme: default
flowchart:
layout: dagre
curve: basis
themeVariables:
primaryColor: '#fefcbf'
primaryTextColor: '#2d3748'
lineColor: '#4a5568'
textColor: '#2d3748'
fontSize: 16px
---
flowchart LR
Code["💻 Commit Code"]
Build["🏗️ Build App"]
Test["🧪 Run Tests"]
Deploy{"Deploy Success?"}
Prod["🚀 Deploy to Prod"]
Rollback["↩️ Rollback"]
Notify["📣 Notify Team"]
Code --> Build --> Test --> Deploy
Deploy -- Yes --> Prod --> Notify
Deploy -- No --> Rollback --> Notify
classDef action fill:#e2e8f0,stroke:#4a5568
classDef decision fill:#b2f5ea,stroke:#319795
classDef error fill:#fed7d7,stroke:#c53030
classDef event fill:#fed7e2,stroke:#d53f8c
class Code,Build,Test,Prod action
class Deploy decision
class Rollback error
class Notify event
subgraph Legend [ ]
direction LR
A([⬤ Action]):::action
B([⬤ Decision]):::decision
C([⬤ Rollback/Error]):::error
D([⬤ Notification]):::event
endA Live Demo: Visualizing a Complex Topic from Every Angle
Explaining a dense, multi-faceted topic like the Microsoft 365 Fundamentals (MS-900) curriculum is a perfect challenge for a diagramming tool. I put Mermaid Pro, my AI-powered diagram generator, to the test to demonstrate how it can instantly translate conversational prompts into a variety of clear, professional visuals.
This is the story of that demonstration, showcasing the tool's power to move from high-level planning to granular technical detail in just a few commands.
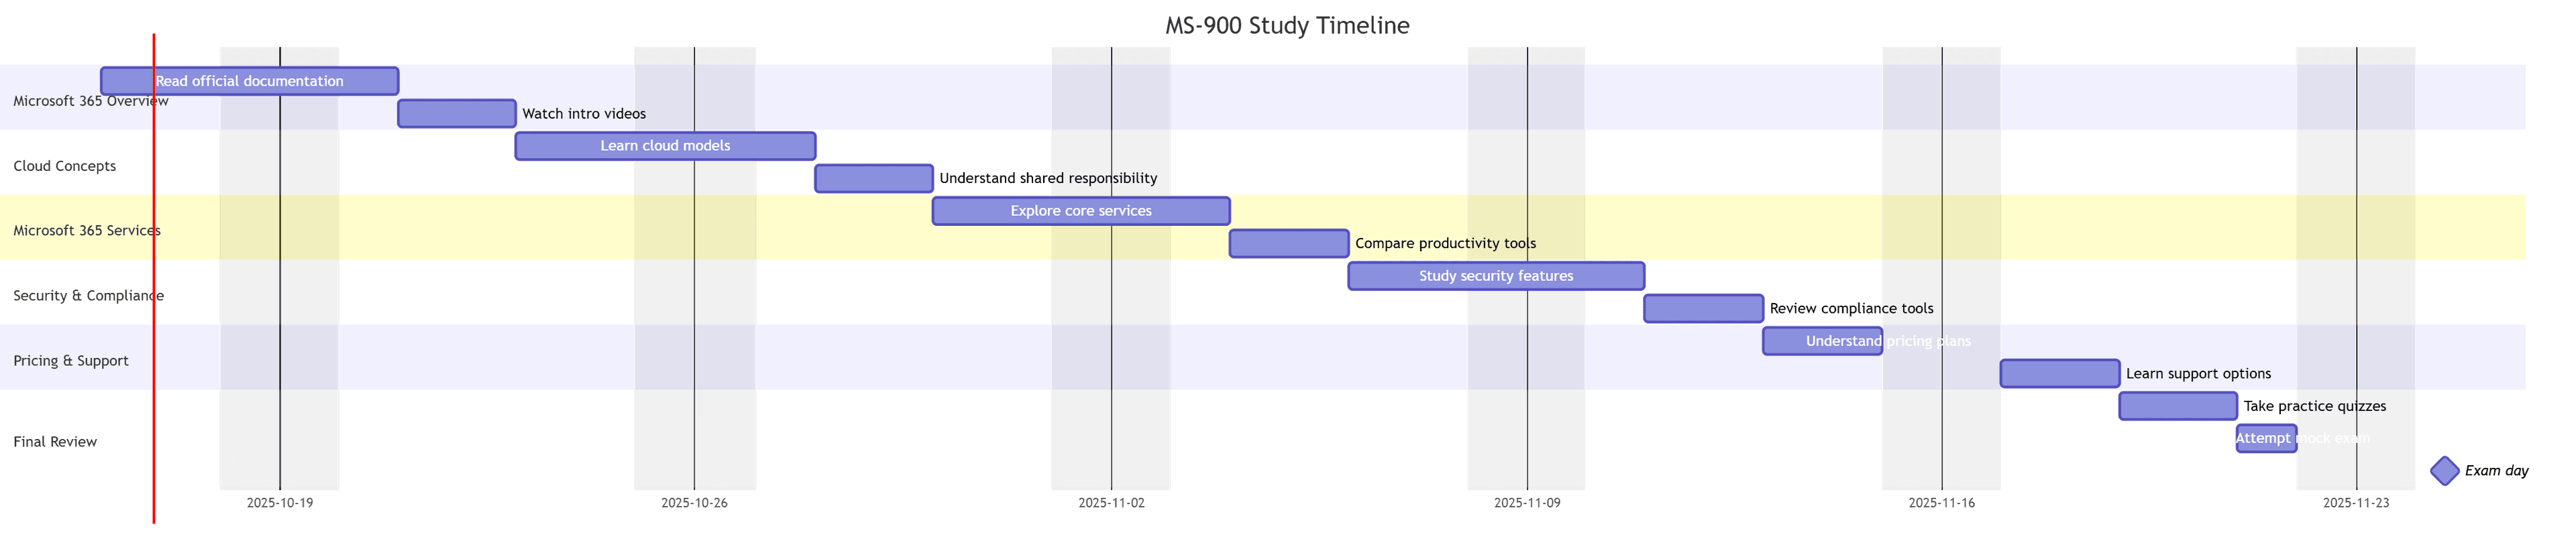
1. The Starting Point: A Project Plan as a Gantt Chart
Every complex project needs a timeline. To demonstrate project planning capabilities, I started with a prompt to create a Gantt chart for an MS-900 study plan. The result was an instant, organized timeline, showing how Mermaid Pro can tackle project management visuals right out of the box.
2. The 10,000-Foot View: A Mind Map of Core Topics
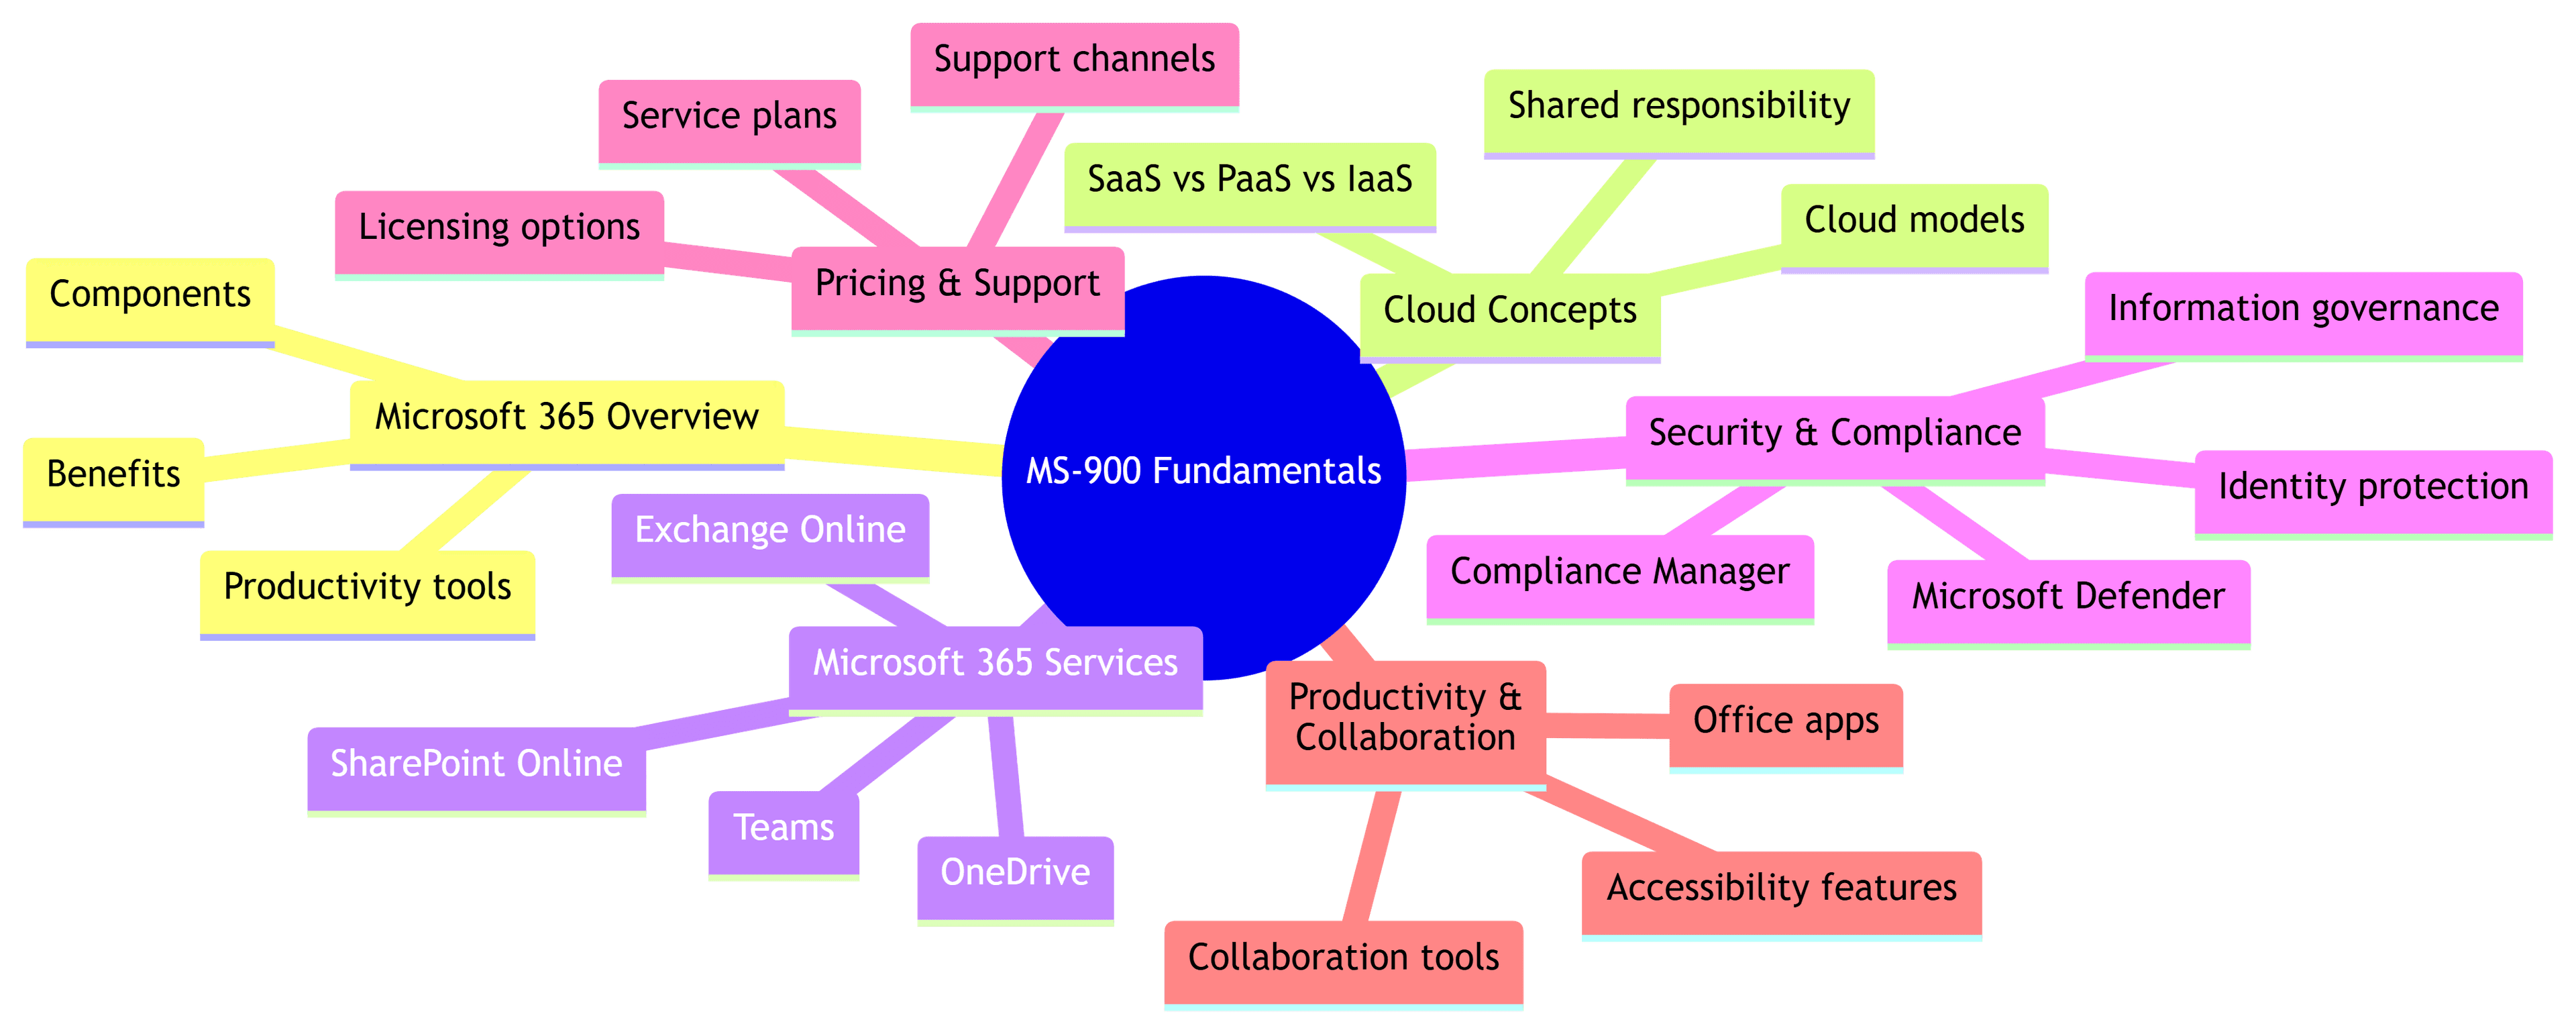
Next, to show how Mermaid Pro organizes broad concepts, I asked it to 'make a mindmap of MS-900 topics.' The AI immediately generated a clear, high-level overview that structured the exam's main domains, perfect for getting a grasp of the entire subject at a glance.
3. The Power of Conversation: Iteratively Adding Detail
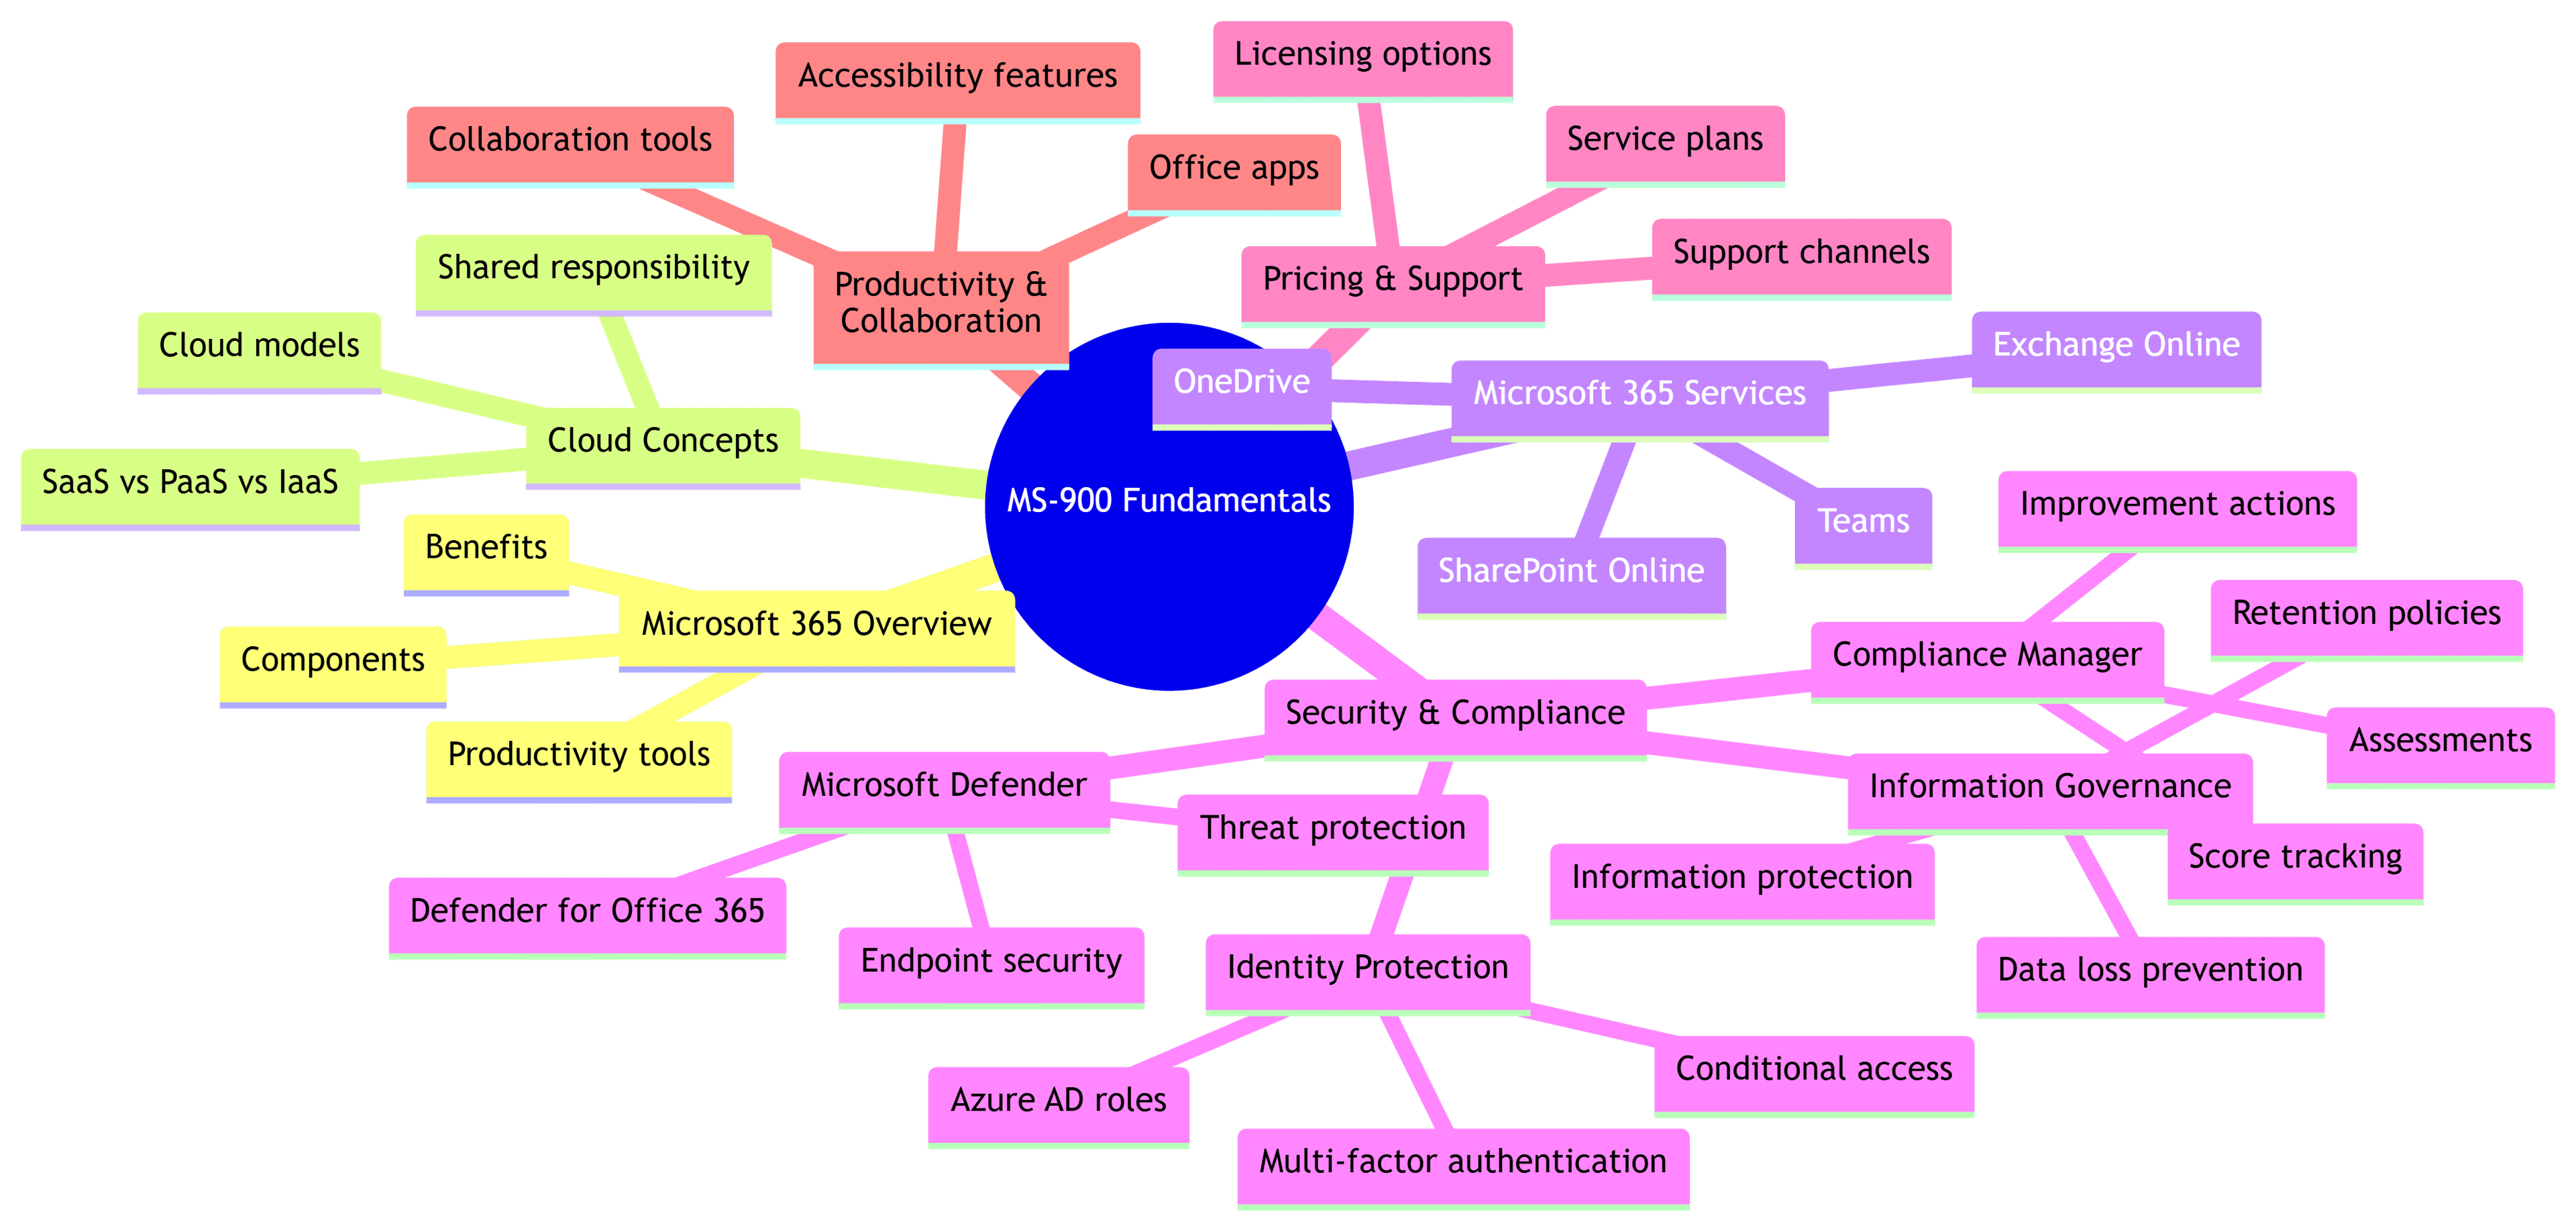
A key feature of Mermaid Pro is its conversational ability. To demonstrate this, I asked it to 'add more detail to Security & Compliance.' The AI didn't start over; it intelligently expanded upon the existing mind map, adding a new layer of detail to the specified section. This highlights how users can refine diagrams on the fly.
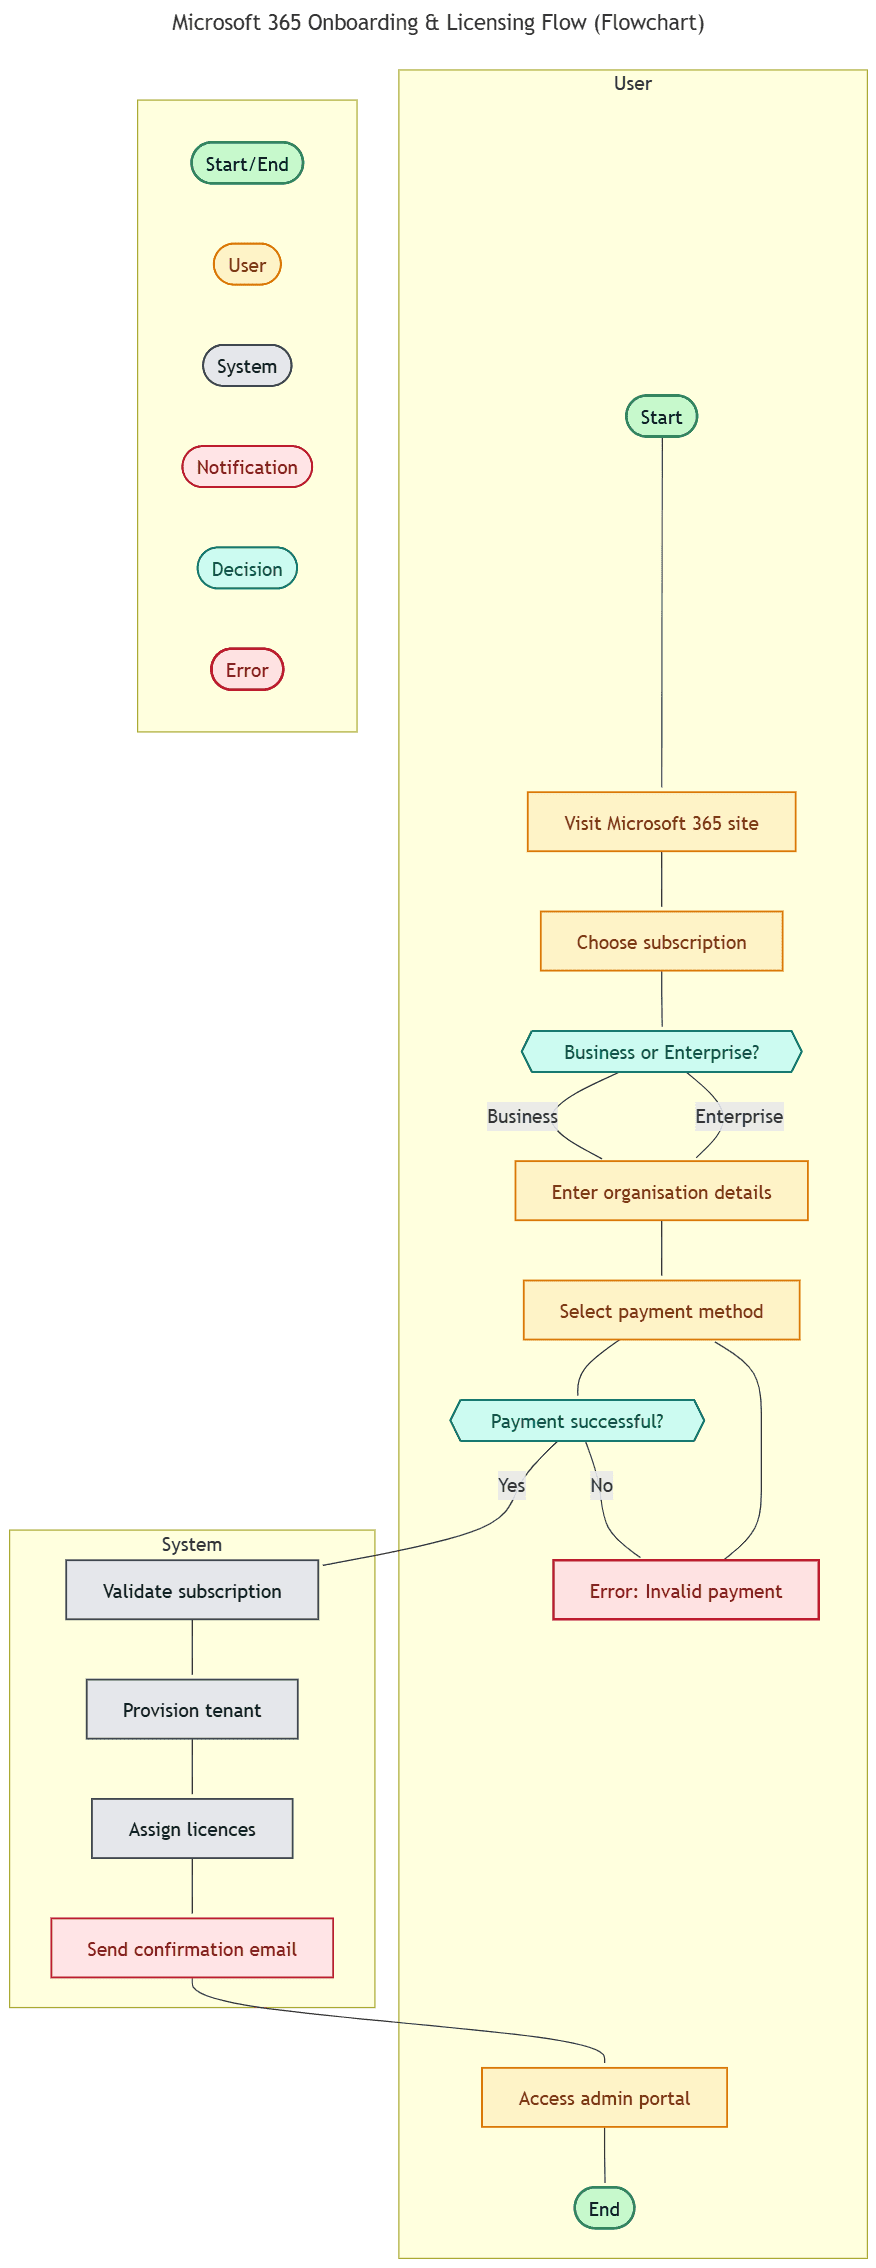
4. The Process Explained: A Complex Flowchart
To demonstrate how the tool handles complex workflows, I prompted it for a 'complex flowchart.' Mermaid Pro produced a detailed diagram of the Microsoft 365 onboarding and licensing process, correctly using flowchart conventions to map out decisions, user actions, and system steps.
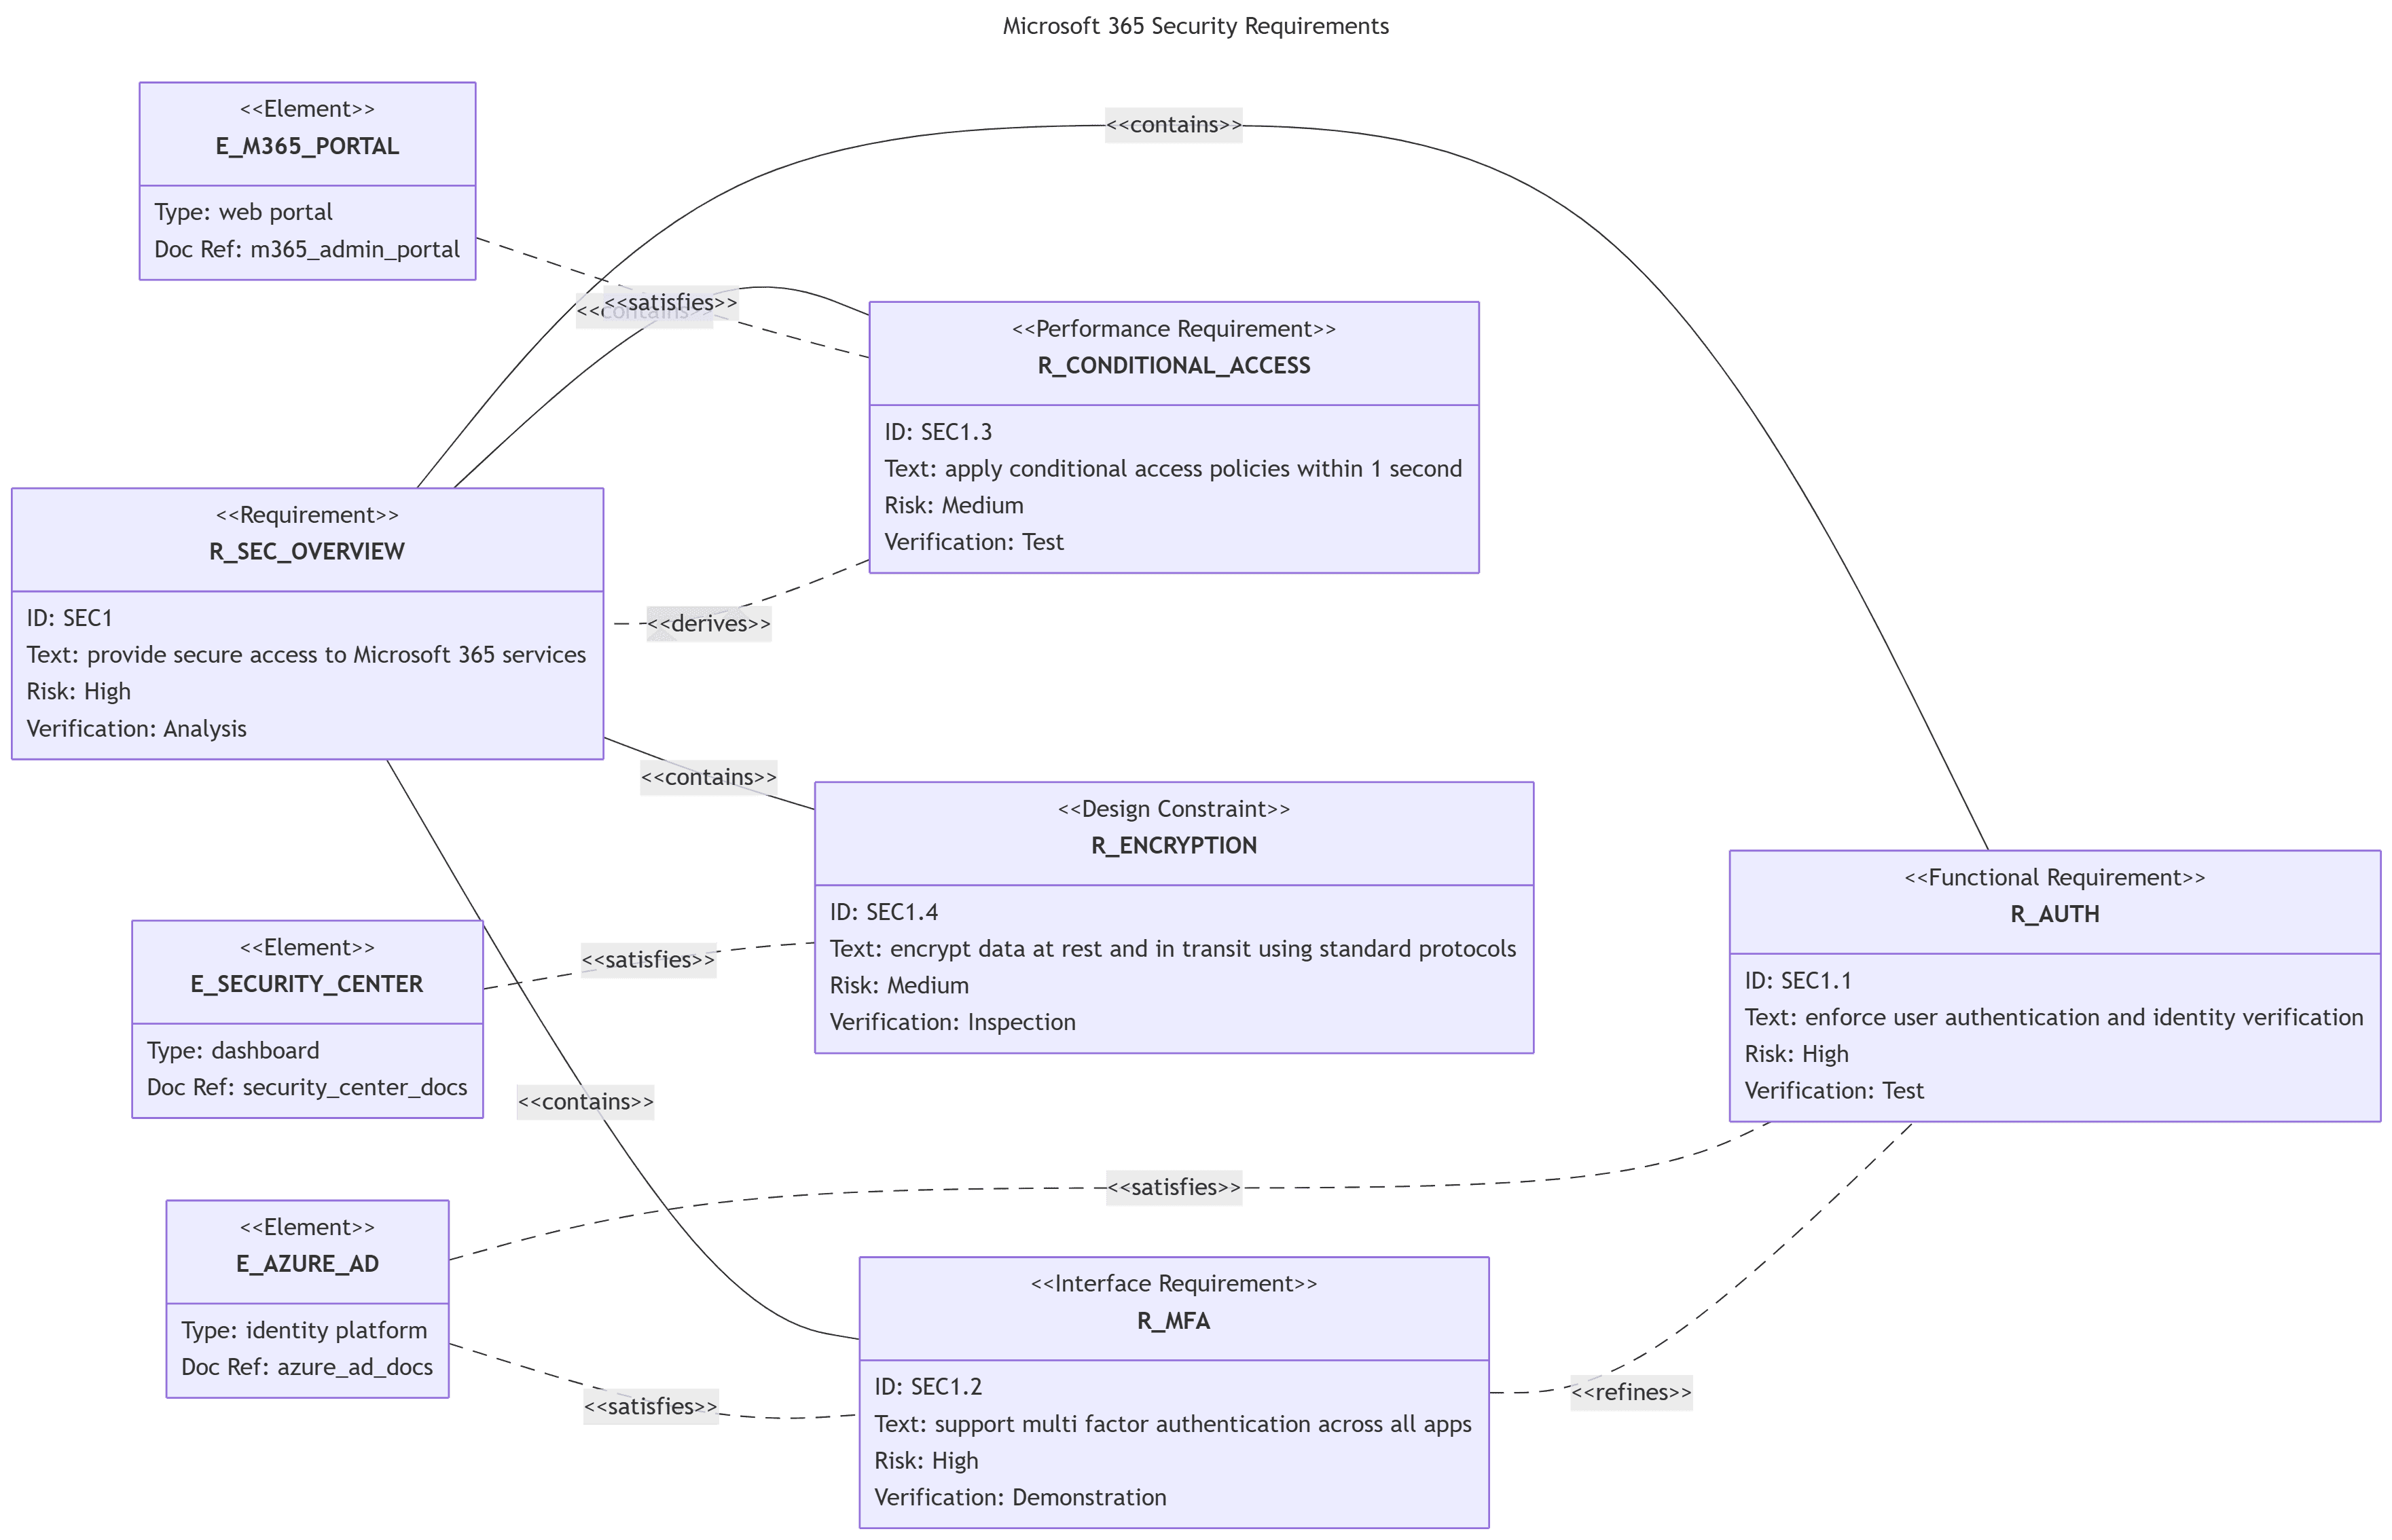
5. The Technical View: A Formal Requirement Diagram
To showcase its capabilities for more technical and engineering-focused documentation, I asked for a 'requirement diagram for Microsoft 365 security.' This generated a formal diagram illustrating the relationships between high-level requirements, system elements, and design constraints, proving its utility for technical specifications.
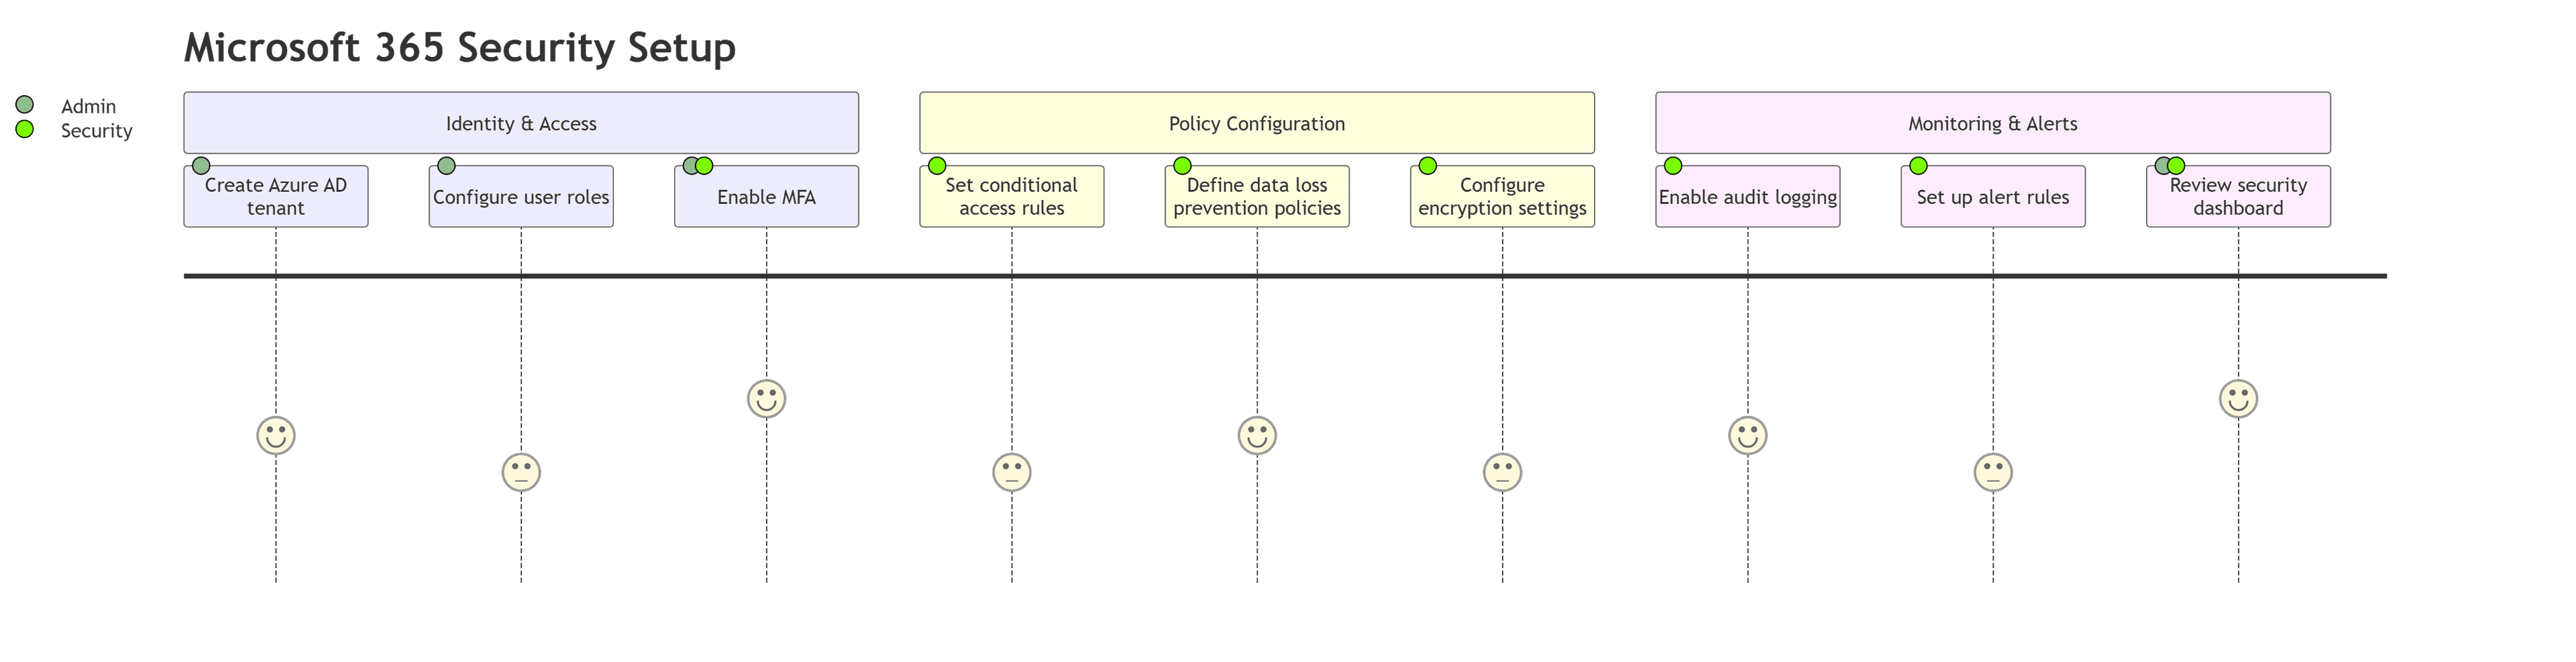
6. The Human Element: A User Journey Map
Finally, to demonstrate a user-centric perspective, I prompted it to 'generate a user journey for security setup.' The resulting diagram effectively mapped out an administrator's experience, focusing on the stages and steps from their point of view. This is ideal for product management, UX design, and service delivery planning.
In just a few minutes and a handful of simple, conversational prompts, this demonstration proved Mermaid Pro's ability to visualize a single, complex topic from 6 distinct and valuable perspectives.
Key Features
- Natural Language to Diagram: Converts unstructured text into structured, visual flowcharts.
- Iterative Refinement: Users can ask for changes in follow-up messages (e.g., 'change the color of the 'Done' step to green'), making the process truly conversational.
- Live Diagram Rendering: Instantly visualizes the generated Mermaid syntax.
- Export to PNG: Allows users to easily save and share the final diagram.
“This project demonstrates the power of generative AI to act as a 'translator' between human language and machine-readable formats, automating complex creative tasks through simple conversation.”